The Operational Cyber Resilience Platform
Connect observability with actionability for improved business outcomes and preemptive exposure mitigation.
What is Operational Cyber Resilience?
For the modern enterprise, Operational Cyber Resilience means accepting that a cyber attack is not a matter of if, but when, and ensuring your business can withstand and recover from it without disruption. With regulations like the SEC Cybersecurity Disclosure Rules putting personal liability on CISOs, organizations can no longer just build bigger walls; they must be able to operate through an incident and report on it transparently.
This requires a paradigm shift. By leveraging AI and Machine Learning, enterprises can achieve true operational resilience — using data not just to preemptively harden defenses, but to bridge the gap between continuous visibility and immediate actionability, allowing teams to mobilize instantly and prevent incidents proactively.

Key Benefits of our Operational Cyber Resilience Platform
From increased visibility to data-driven exposure mitigation, Onyxia’s Operational Resilience Platform offers several key advantages for security leaders.
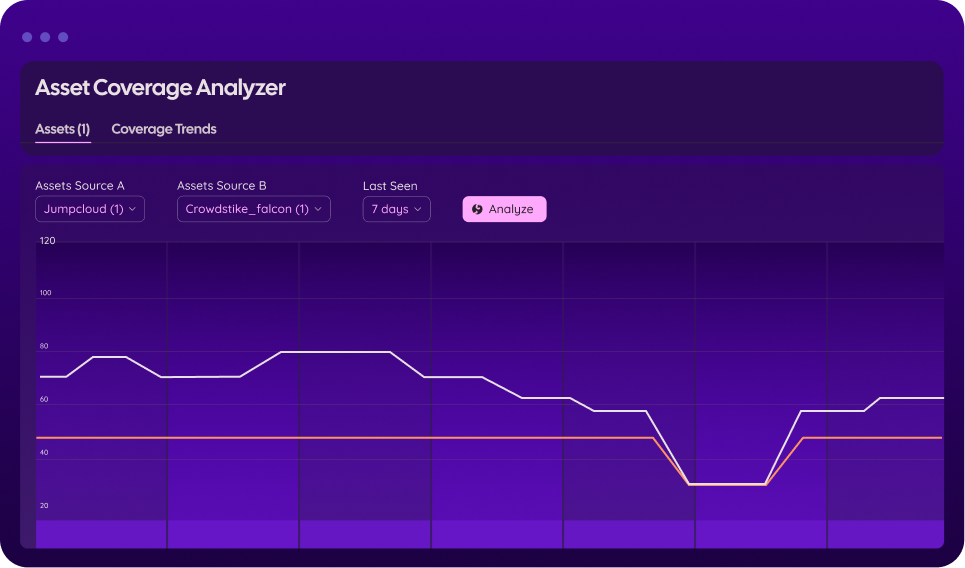
Asset Coverage and Security Stack Optimization
Optimize tech stack efficiency and ROI. Identify gaps or overlaps in coverage and ensure alignment with key compliance frameworks.
Agentic and Proactive Exposure Mitigation
Prevent future crises with actionable, AI-driven plans to reduce risk exposure and cross-domain context to improve security posture.
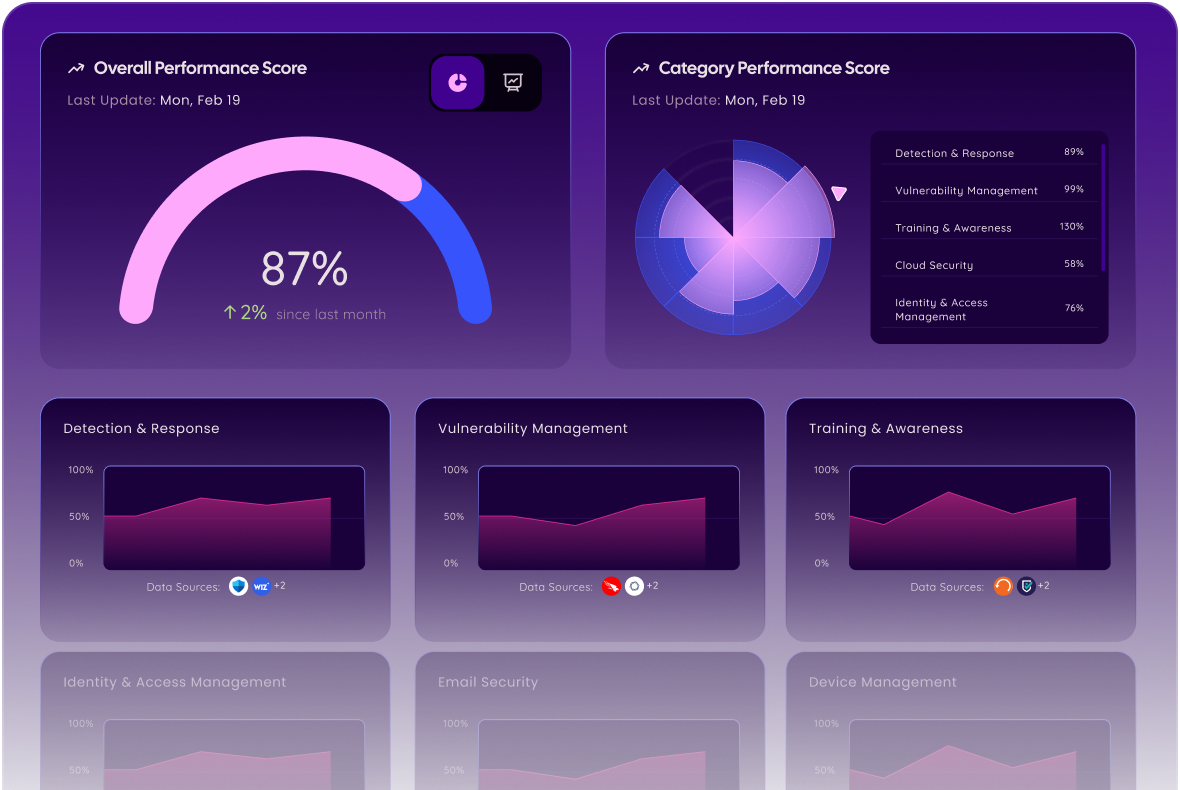
Data-Driven and Dynamic Cyber Governance
Automate tailor-made program assessments, analyze historical performance, and mobilize team operations.
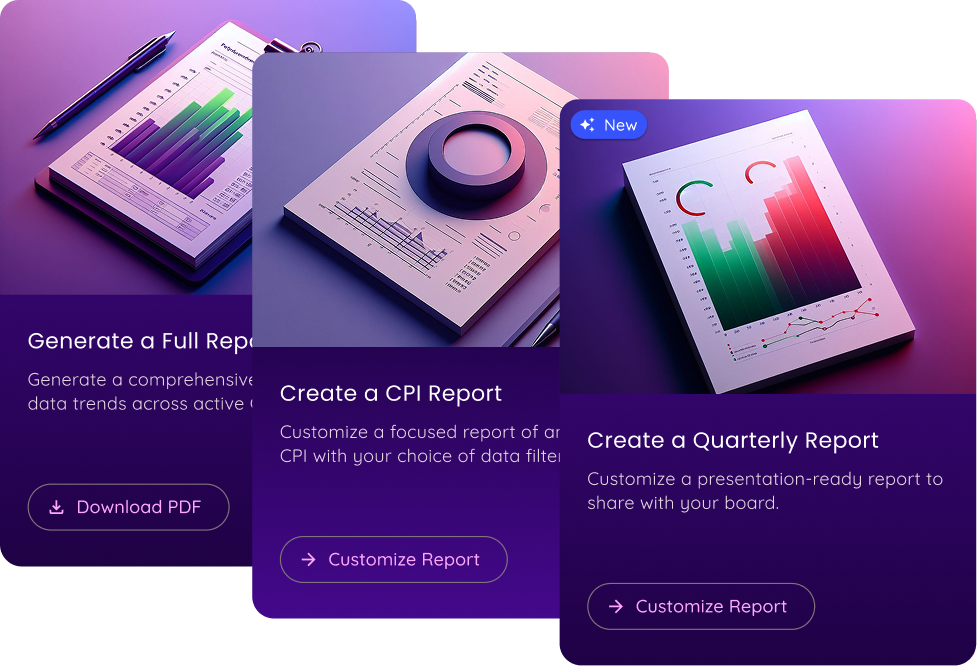
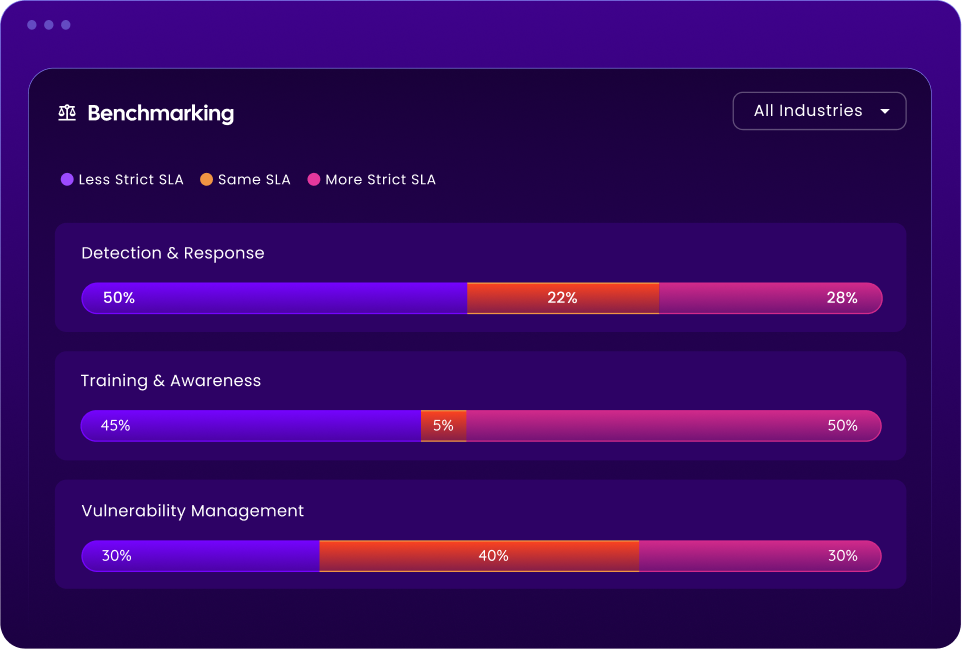
Streamlined Business and Board Reporting
Pull customized board reports, address cyber risk committees, and demonstrate industry compliance.
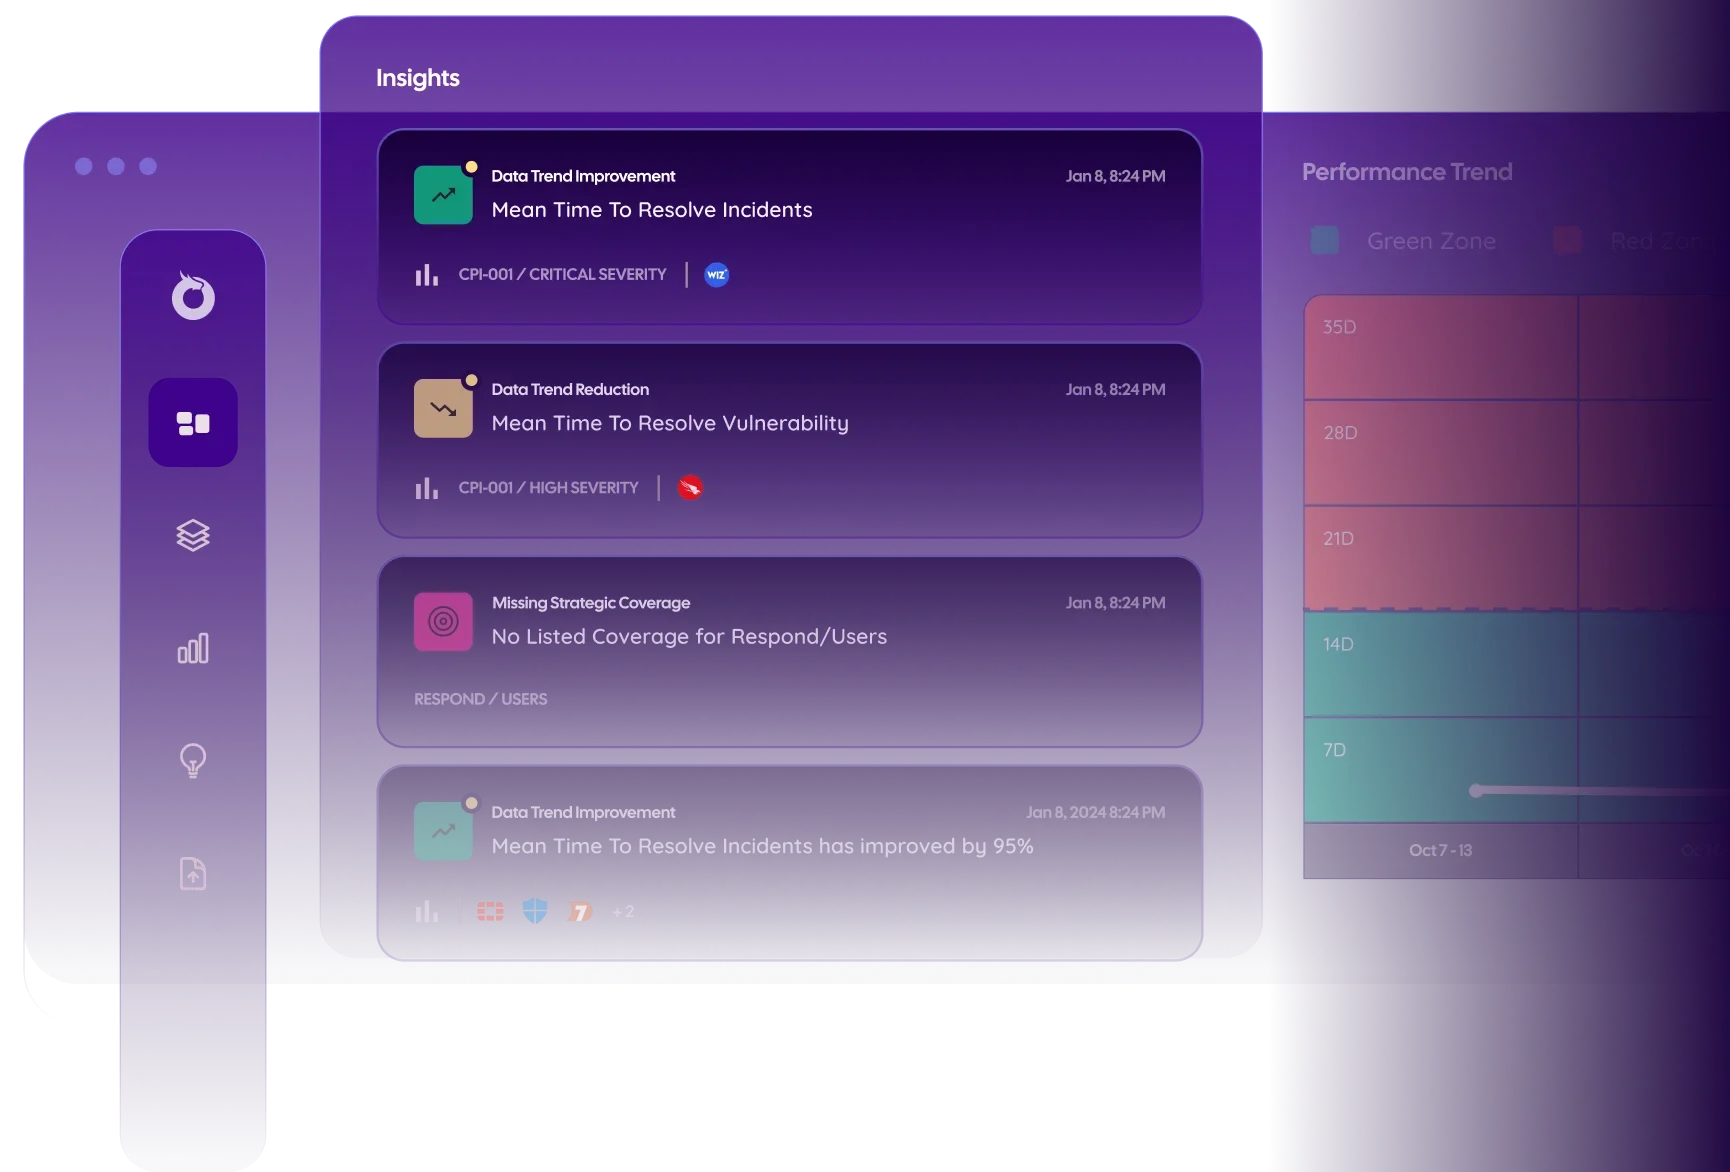
Bridging Business Outcomes to Day-to-Day Operations
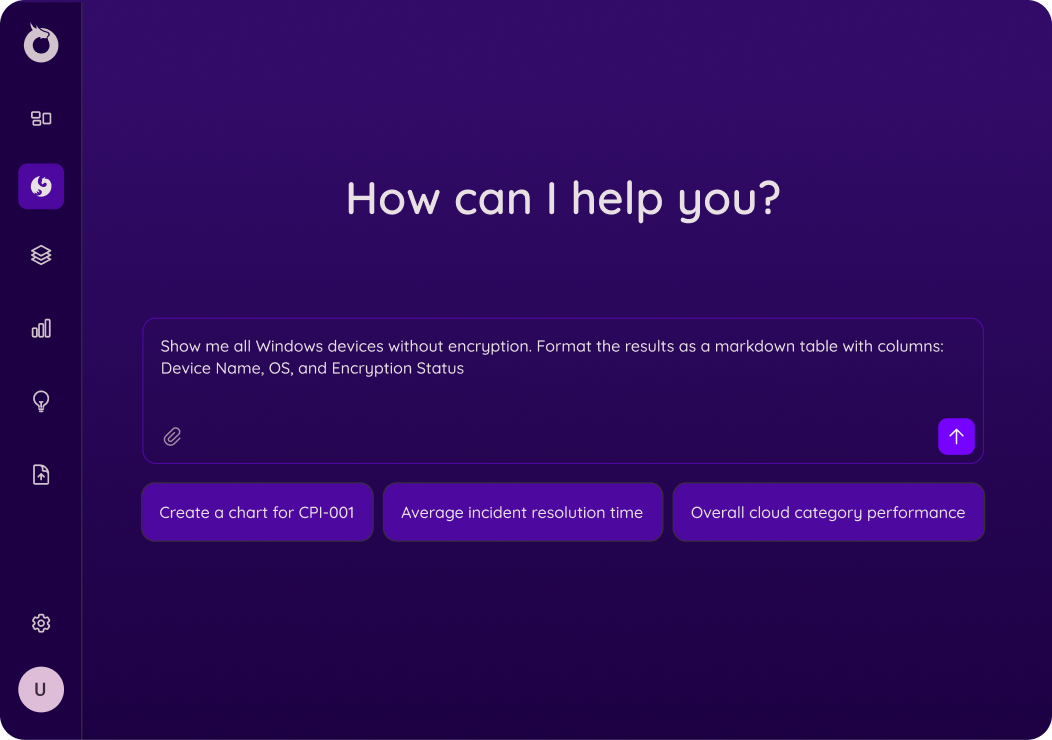
Context-Aware
Every organization is unique. Through Nexa, our AI security agent, you can receive contextualized insights and actionable mitigation plans tailored to your organization’s security environment.

Instant Set Up
Instantly connect your security stack to gain coverage insights, enable data-driven governance and automate customized board reporting.

AI-Native
Harness the power of AI and Machine Learning to gain predictive intelligence to mitigate potential exposures - before they become critical.

Mobile-First
Get invaluable internal and external threat intelligence and cybersecurity program updates, directly to your mobile device.