Govern Your Security Program in a Data-Driven Way
Onyxia allows you to easily measure and customize cybersecurity metrics, consolidate and automate performance tracking, see how your security program is performing against industry standards, and conduct on-demand risk assessments with real-time data.

We have a vast library of Cybersecurity Performance Indicators (CPIs) to choose from and customize. With Onyxia you choose and activate the most important metrics to easily communicate your security program initiatives.
Make an Impact With Your
Security Program Story
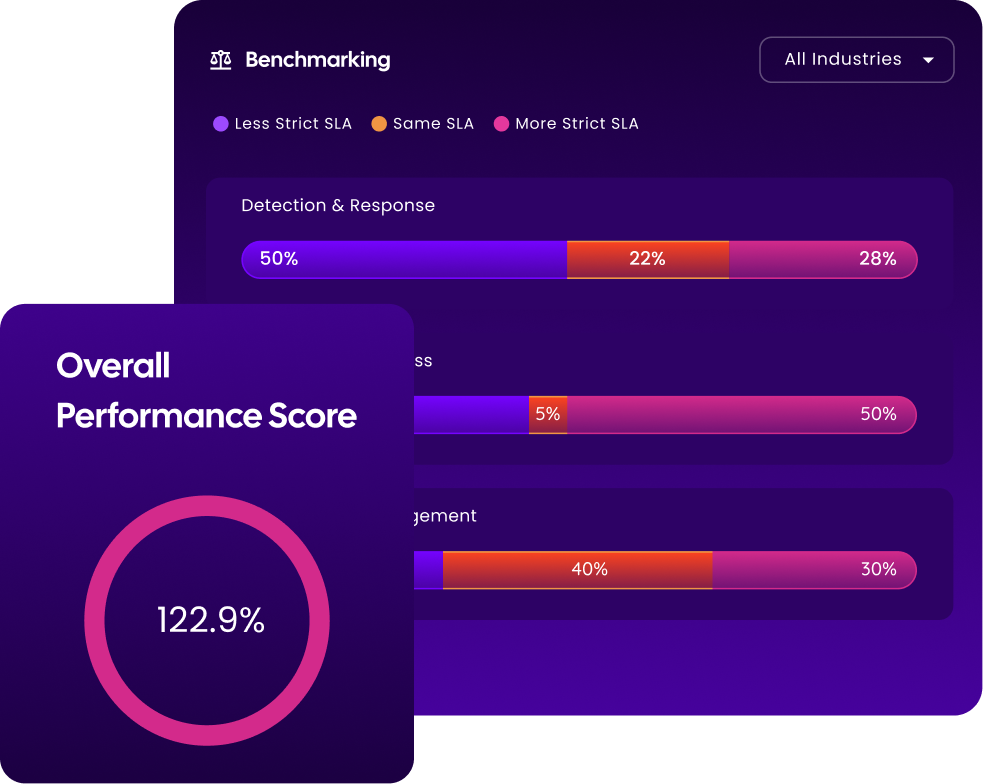
Create a more accurate measurement of your security program with Onyxia. We enable on-demand benchmarking using historical data and real-time performance and allow you to compare your SLAs against industry standards.
Enhanced Benchmarking For A True Performance Score

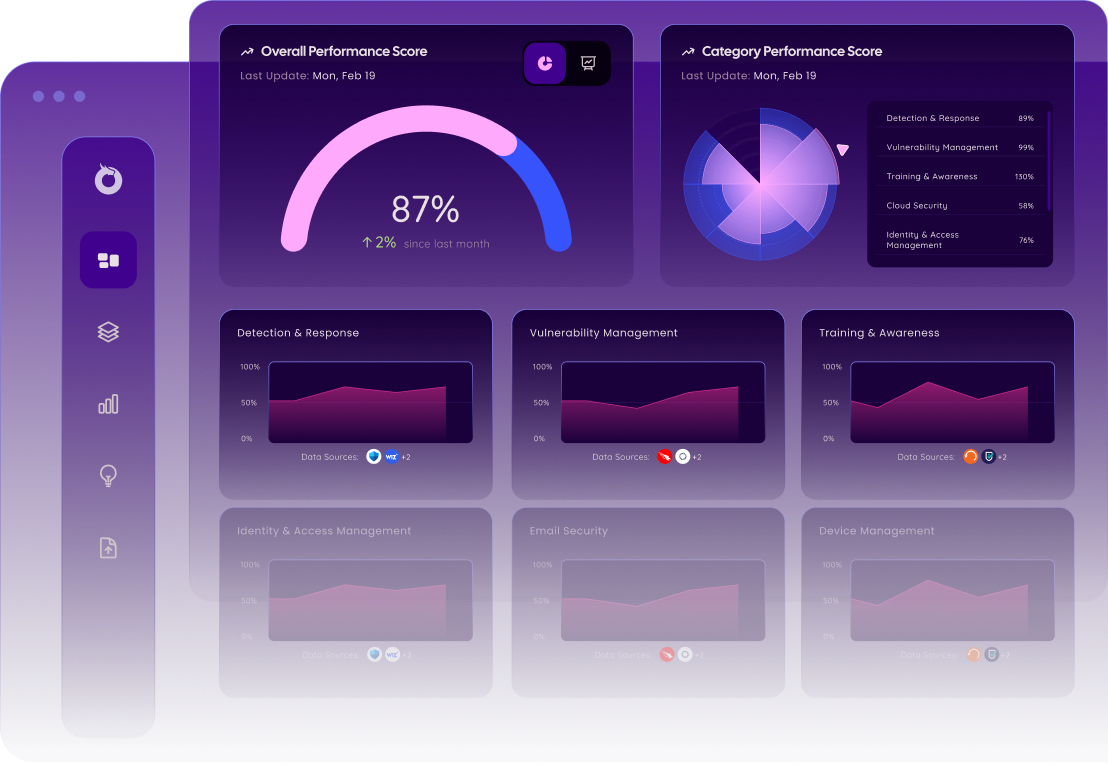
Ditch the Spreadsheets and Automatically Visualize Program Performance
See your historical data visually transformed and instantly gain a clear picture of your security metrics performance. Filter your Cybersecurity Performance Indicators (CPIs) by severity level, timeframe, reporting frequency, and data source.
Benefits of Onyxia’s Data-Driven Governance
Preemptively Mitigate Threat Exposures
Immediately uncover gaps in coverage and forecast future program performance to mitigate risk exposures.
Increase Operational Effectiveness
Effectively convey the value of your cybersecurity investments as it relates to the business’ health and bottom line.
Automate Executive Reporting
Gain buy-in from the board and additional stakeholders for strategic cybersecurity measures to prevent ever-evolving cyber risk.